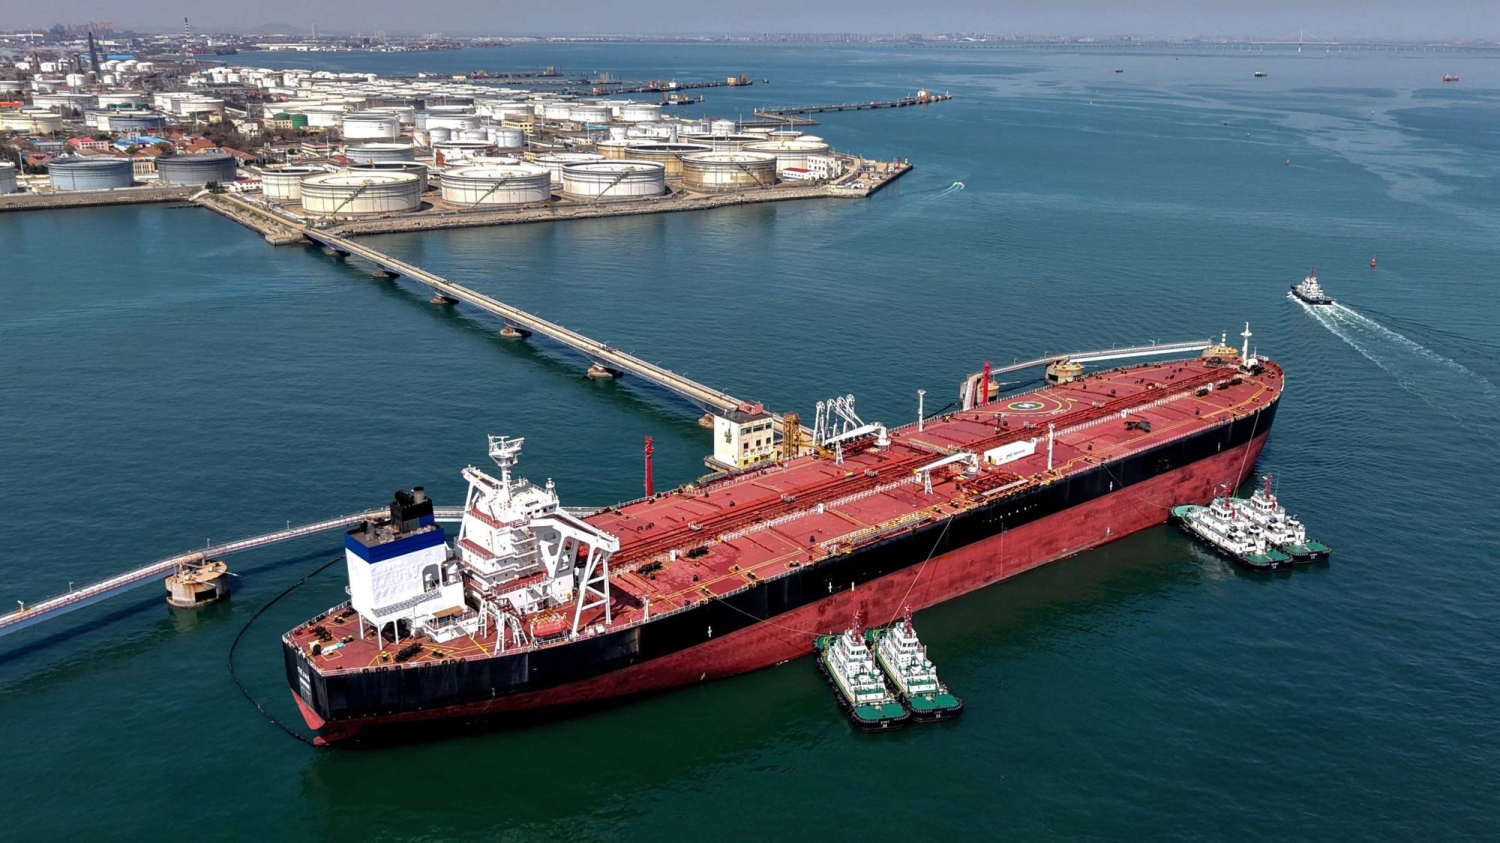
An oil tanker is docked unloading crude oil at the port in Qingdao, in China's eastern Shandong province, on April 7, 2026. (Photo by CN-STR / AFP) / China OUT
Merchandise exports grow 18.51%; electronics exports surge 70.44% in September
NEW DELHI, Oct 16: India’s total exports of merchandise and services are estimated to have grown 13.84% to $476.20 billion during April-September 2026-27, compared with $418.31 billion in the corresponding period of the previous financial year, according to data released by the Union government on Thursday.
Total imports during the six-month period rose 15.68% to $551.13 billion, widening the combined merchandise and services trade deficit to $74.93 billion from $58.10 billion a year earlier.
Merchandise exports registered stronger growth, increasing 18.51% to $259.89 billion during April-September 2026-27, against $219.30 billion in the corresponding period of 2025-26.
Non-petroleum exports also recorded positive growth, rising 15.56% to $218.70 billion from $189.26 billion.
According to the Ministry of Commerce and Industry’s estimates, India’s total exports in September 2026 increased 10.99% year-on-year to $80.75 billion, compared with $72.76 billion in September 2025.
Total imports during the month rose 8.19% to $94.05 billion from $86.93 billion, reducing the overall trade deficit to $13.30 billion from $14.17 billion a year earlier.
Merchandise exports rise 23% in September
Merchandise exports increased to $44.40 billion in September 2026 from $36.08 billion in the corresponding month last year, while merchandise imports rose to $74.61 billion from $69.08 billion.
The merchandise trade deficit for April-September 2026-27 widened to $177.64 billion, compared with $156.88 billion in the same period of the previous financial year, as imports increased to $437.53 billion from $376.17 billion.
Electronics, petroleum products, chemicals and engineering goods were among the major contributors to merchandise export growth in September.
Electronic goods exports recorded the highest growth among the major categories, rising 70.44% to $5.31 billion from $3.11 billion in September 2025.
Petroleum product exports increased 31.90% to $6.22 billion, while organic and inorganic chemical exports grew 24.21% to $2.94 billion.
Engineering goods exports rose 20.91% to $12.17 billion from $10.06 billion. Exports of cotton yarn, fabrics, made-ups and handloom products increased 20.76% to $1.12 billion from $0.93 billion.
Other sectors registering positive export growth included handicrafts excluding handmade carpets, which grew 43.19%; meat, dairy and poultry products, up 35.18%; plastics and linoleum, up 24.81%; and carpets, up 19.81%.
Exports of gems and jewellery, cereal preparations, textiles, marine products, pharmaceuticals, rice and spices also recorded year-on-year growth.
Services exports remain a key contributor
Services exports were estimated at $36.35 billion in September 2026, marginally below $36.67 billion in September 2025. Services imports increased to $19.44 billion from $17.84 billion.
For April-September 2026-27, services exports grew 8.69% to $216.31 billion from $199.02 billion. Services imports rose to $113.60 billion from $100.24 billion.
The services trade surplus increased to $102.71 billion during the six-month period, compared with $98.77 billion a year earlier, helping offset part of the merchandise trade deficit.
The ministry said the September figures for services trade were estimates, as the latest available Reserve Bank of India data covered August 2026.
Singapore, US and China among key export destinations
Among India’s export destinations, Singapore recorded a 169.16% increase in export value in September 2026 compared with the same month last year. Exports to Malaysia rose 119.69%, Egypt 90.09%, the United States 47.99% and China 24.05%.
For April-September 2026-27, exports to Tanzania increased 122.51%, Singapore 103.05%, Malaysia 82.85%, China 36.07% and the United States 11.11%.
On the import side, Oman recorded a 331.82% increase in import value in September, followed by South Korea at 52.93%, Singapore at 36.44%, China at 31.52% and Russia at 25.63%.
For the April-September period, imports from Oman rose 210.9%, Brazil 143.13%, Russia 51.97%, the United States 25.98% and China 27.82%.
The data also showed declines in September imports of project goods, gold, silver, fertilisers, newsprint, iron and steel, wood products, and medicinal and pharmaceutical products.
The figures were released by the Ministry of Commerce and Industry on October 15. The ministry noted that the services trade figures for September were estimates and that some earlier data had been revised using quarterly balance-of-payments figures.
16 COMMENTS
For the reason that the admin of this site is working, no uncertainty very quickly it will be renowned, due to its quality contents.
Invisalign treatment uses clear aligners to gradually move teeth into improved positions. Mint Dental Clinic provides consultation and treatment planning for suitable patients.
Mint Dental Clinic offers children’s dental care in Mumbai with a focus on comfortable visits, preventive care, healthy dental habits, and treatment when required.
Mint Dental Clinic offers comprehensive dental services in Mumbai for children, adults, and families, including preventive, restorative, cosmetic, and orthodontic care.


For the reason that the admin of this site is working, no uncertainty very quickly it will be renowned, due to its quality contents.
F8BET thương hiệu nổi bật 2026 . Nạp đầu nhận ngay 68k.
Great information shared.. really enjoyed reading this post thank you author for sharing this post .. appreciated
Mint Dental Clinic is a dental clinic in Dadar offering general, cosmetic, restorative, orthodontic, implant, and children’s dental treatments.
I really like reading through a post that can make men and women think. Also, thank you for allowing me to comment!
Çok yararlı bi yazı olmuş hocam teşekkür ederim .Sizin yazılarınızı beğenerek okuyorum elinize sağlık.
Invisalign treatment uses clear aligners to gradually move teeth into improved positions. Mint Dental Clinic provides consultation and treatment planning for suitable patients.
Mint Dental Clinic provides personalised dental care in Dadar with treatments focused on comfort, oral health, and individual dental needs.
This caught my attention! 👀 Can you please share more details about how these gift card offers work? 🎁 https://mub.me/nUoA
Awesome! Its genuinely remarkable post, I have got much clear idea regarding from this post
Mint Dental Clinic offers children’s dental care in Mumbai with a focus on comfortable visits, preventive care, healthy dental habits, and treatment when required.
I do not even understand how I ended up here, but I assumed this publish used to be great
Mint Dental Clinic offers clear aligner treatment in Mumbai for suitable cases where teeth need gradual and controlled alignment.
Pretty! This has been a really wonderful post. Many thanks for providing these details.
Mint Dental Clinic offers comprehensive dental services in Mumbai for children, adults, and families, including preventive, restorative, cosmetic, and orthodontic care.
Patients in Dadar can explore Invisalign treatment at Mint Dental Clinic for discreet teeth alignment using a series of removable clear aligners.